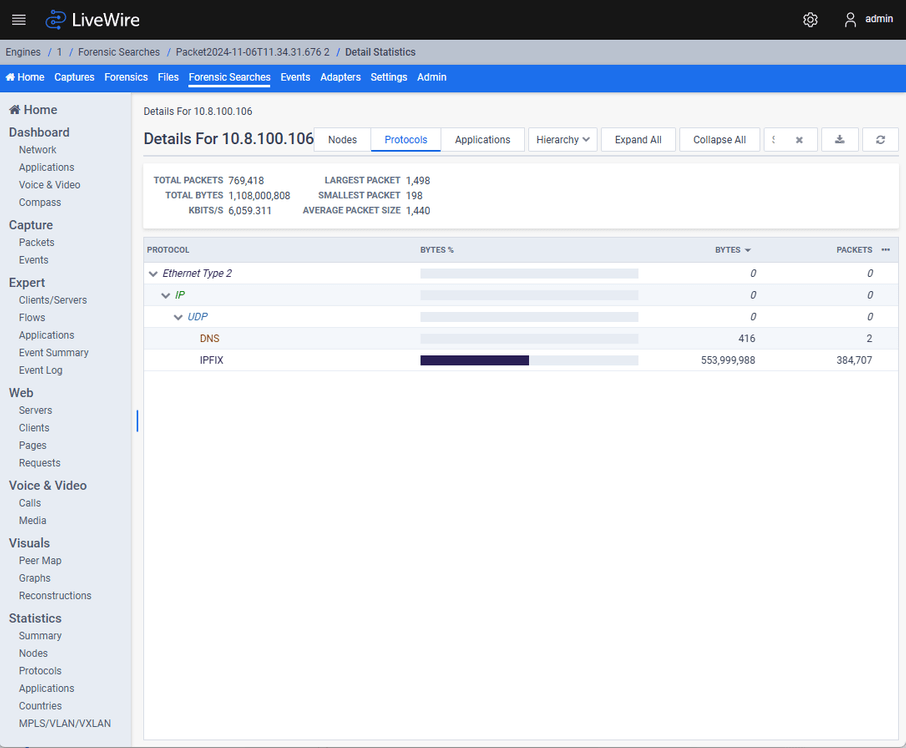
The Details Statistics View
The Details Statistics View Features:
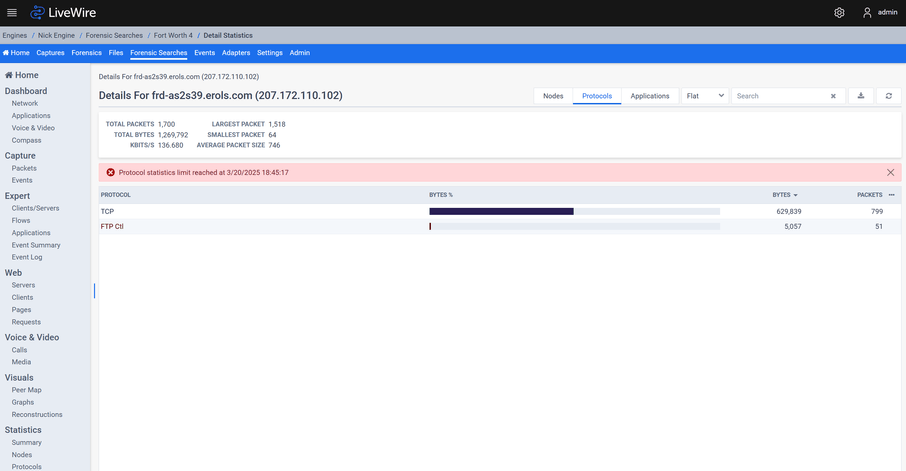
◦ When in the Details Statistics View, the user has the option of picking any node, protocol or application and requesting the details for it as well. Because of this, this view can become nested as the user continues to request details. For this reason, the very top of the view features a breadcrumb path showing all of the Details Statistics Views the user has viewed since launching from the initial request to see details from one of the Statistics views or Peer Map. The most recent Details Statistics View is shown on the far right , and the less recent Details Statistics View is shown on the far left. All breadcrumb items are a clickable link that will take the user back to that Details Statistics View, except for the most recent Details Statistics View on the far right since that’s the view the user is currently viewing.
◦ Directly under the breadcrumbs and to the left is the title of the Details Statistics View. This title will vary depending on whether the user is viewing the details for a node, protocol, application, nodes conversation, node + protocol conversation or node + application conversation.
◦ Directly under the title of the Details Statistics View is the Statistics Panel which displays statistics about the nodes in the view:
◦ “Total Packets”: The total number of packets
◦ “Total Bytes”: The total number of bytes
◦ “kbits/s”: The utilization
◦ “Largest Packet”: The largest packet size
◦ “Smallest Packet”: The smallest packet size
◦ “Average Packet Size”: The average packet size
◦ Directly under the breadcrumbs and to the right are controls to modify the view:
◦ If there are any nodes to display, a “Nodes” button will be displayed. Clicking this “Nodes” button will display a list of nodes below the Statistics Panel.
◦ If there are any protocols to display, a “Protocols” button will be displayed. Clicking this “Protocols” button will display a list of protocols below the Statistics Panel.
◦ If there are any applications to display, a “Applications” button will be displayed. Clicking this “Applications” button will display a list of applications below the Statistics Panel.
◦ When the user is viewing protocols or applications:
◦ The user will be able to specify whether to view them in a “Flat” layout or “Hierarchy” layout from a dropdown. This setting will be remembered between Details Statistics Views.
◦ The user will be able to click the “Expand All” button to expand all items in the tree view.
◦ The user will be able to click the “Collapse All” button to collapse all items in the tree view.
◦ A Search bar will allow the user to filter the nodes, protocols or applications displayed. This setting will be remembered between Details Statistics Views.
◦ When displaying protocols in “Hierarchy” mode, the filter will only apply to the items without children in the tree view.
◦ When displaying applications in “Hierarchy” mode, the filter will only apply to the items without children in the tree view.
◦ Any items in the tree view with no children due to the filter will be hidden.
◦ An Export button will export the current view as configured and displayed into a CSV file and automatically download it to the host machine. This CSV file will be named one of the following based on which statistics are currently displayed when the export action is executed: “Application Details Statistics”, “Node Details Statistics” or “Protocol Details Statistics”.
◦ A Refresh button will refresh the Details Statistics View.
◦ For Captures, the Details Statistics View will refresh every 30 seconds.
Nodes
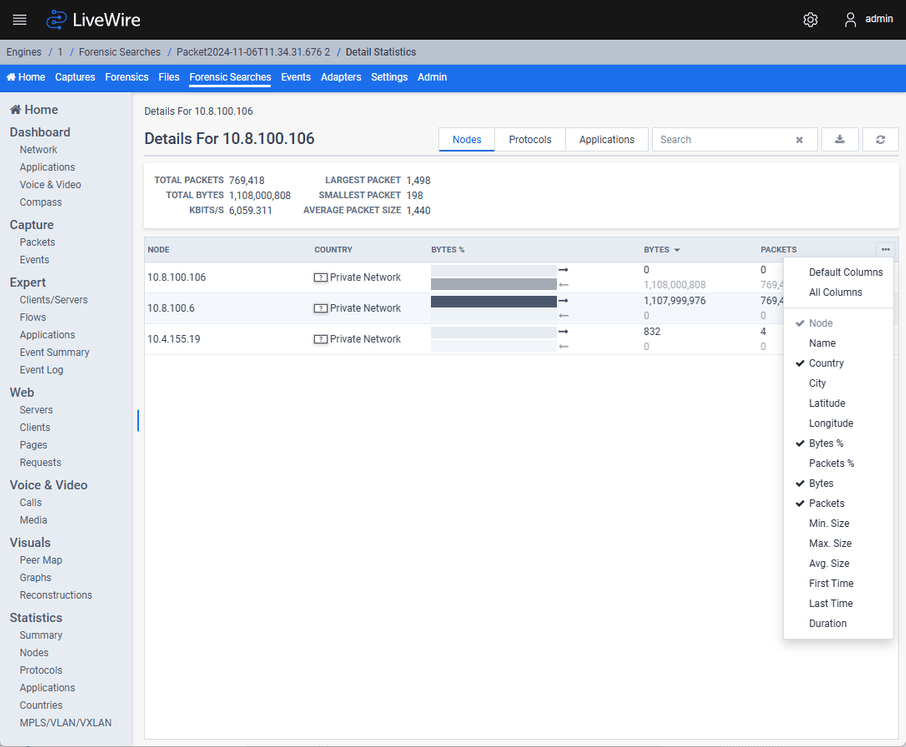
The nodes table can display the following values, which the user can toggle by clicking the “…” button on the far right of the table header:
◦ “Node” (default): If the “Show Address Names” is enabled in the configuration options (gear icon in the top left), the name of the node is shown if there is one. Otherwise, the IP, IPv6 or physical address of the node is displayed. If a color is associated with this node, the text will be displayed in that color.
◦ “Name”: The name of the node is shown if there is one. If a color is associated with this node, the text will be displayed in that color.
◦ “Country”: The country for the node is displayed if it can be calculated.
◦ “City”: The city for the node is displayed if it can be calculated.
◦ “Latitude”: The latitude for the node is displayed if it can be calculated.
◦ “Longitude”: The longitude for the node is displayed if it can be calculated.
◦ “Bytes %”: 2 bars will be displayed along with a direction arrow
◦ The percentage of bytes sent in comparison with all nodes in the Details Statistics View is displayed on the top (the left arrow indicates “sent”)
◦ The percentage of bytes received in comparison with all nodes in the Details Statistics View is displayed on the bottom (the left arrow indicates “sent”)
◦ Hovering over the bar graph will display the numerical percentage value in a tooltip
◦ If a color is associated with this node, the text will be displayed in that color
◦ Sorting this column will sort based on the sum of both bytes sent and bytes received
◦ “Packets %”:
◦ The percentage of packets sent in comparison with all nodes in the Details Statistics View is displayed on the top (the left arrow indicates “sent”)
◦ The percentage of packets received in comparison with all nodes in the Details Statistics View is displayed on the bottom (the left arrow indicates “sent”)
◦ Hovering over the bar graph will display the numerical percentage value in a tooltip
◦ If a color is associated with this node, the text will be displayed in that color
◦ Sorting this column will sort based on the sum of both packets sent and bytes received
◦ “Bytes” (default):
◦ The bytes sent in comparison with all nodes in the Details Statistics View is displayed on the top
◦ The bytes received in comparison with all nodes in the Details Statistics View is displayed on the bottom
◦ If a color is associated with this node, Omnipeek Windows will display the text in this color, but LiveWire Omnipeek will not
◦ Sorting this column will sort based on the sum of both bytes sent and bytes received
◦ “Packets” (default):
◦ The packets sent in comparison with all nodes in the Details Statistics View is displayed on the top
◦ The packets received in comparison with all nodes in the Details Statistics View is displayed on the bottom
◦ If a color is associated with this node, Omnipeek Windows will display the text in this color, but LiveWire Omnipeek will not
◦ Sorting this column will sort based on the sum of both packets sent and bytes received
◦ “Min. Size”:
◦ The minimum packet size sent for this node is displayed on the top
◦ The minimum packet size received for this node is displayed on the bottom
◦ Sorting this column will sort based on the minimum of both minimum packet size sent and minimum packet size received
◦ “Max. Size”:
◦ The maximum packet size sent for this node is displayed on the top
◦ The maximum packet size received for this node is displayed on the bottom
◦ Sorting this column will sort based on the maximum of both maximum packet size sent and maximum packet size received
◦ “Avg. Size”:
◦ The average packet size sent for this node is displayed on the top
◦ The average packet size received for this node is displayed on the bottom
◦ Sorting this column will sort based on the average of both bytes and packets sent and received
◦ “First Time”:
◦ The timestamp of the first packet sent for this node is displayed on the top
◦ The timestamp of the first packet received sent for this node is displayed on the top
◦ Sorting this column will sort based on the minimum of both first packet sent and first packet received
◦ “Last Time”:
◦ The timestamp of the last packet sent for this node is displayed on the top
◦ The timestamp of the last packet received sent for this node is displayed on the top
◦ Sorting this column will sort based on the maximum of both last packet sent and last packet received
◦ “Duration”: The duration of time in which the packets for this node were captured
Context Menu Operations:
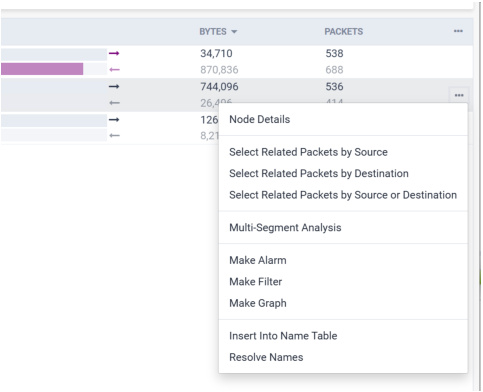
Clicking the “…” button at the end of each row in the table will display the context menu for each node with the following options:
◦ “Node Details”:
◦ Clicking this item will open a new Details Statistics View for the node in addition to the current nodes, protocols or applications for the current Details Statistics View
◦ This item will be disabled if the node is already a part of the current Details Statistics View
◦ “Select Related Packets by Source”: This item will redirect to the Packets View and select all packets in the Packets View that match the node as source. This item is disabled if the user cannot view packets or there are no packets in this Capture or Forensic Search.
◦ “Select Related Packets by Destination”: This item will redirect to the Packets View and select all packets in the Packets View that match the node as destination. This item is disabled if the user cannot view packets or there are no packets in this Capture or Forensic Search.
◦ “Select Related Packets by Source or Destination”: This item will redirect to the Packets View and select all packets in the Packets View that match the node as source or destination. This item is disabled if the user cannot view packets or there are no packets in this Capture or Forensic Search.
◦ “Multi-Segment Analysis”: This item will redirect to the Multi-Segment Analysis View with the start and end time being the first and last time the node was captured (respectively), and the filter pre-populated with a filter for the node. This item is disabled if the user cannot upload files or create a forensic search.
◦ “Make Alarm”: This item will redirect to the Alarms View with the name of the new alarm being the node, and the units being “Total Bytes Per Second”
◦ “Make Filter”: This item will redirect to the Filters View with an address filter pre-populated with a filter for the node to any other address in both directions
◦ “Make Graph”: This item will redirect to the Graphs View with the name of the new graph being the node, and the units being “Bytes”, and the graph table pre-populated with the node and “Total Bytes”
◦ “Insert Into Name Table”: This item will pop up a dialog allowing the user to insert this node into the name table (the name will be pre-populated to the node name, the node type pre-populated to the best match, and the entry pre-populated to the IP, IPv6 or physical name of the node)
◦ “Resolve Names”: This item will attempt to auto-resolve the node and add it to the name table
Protocols
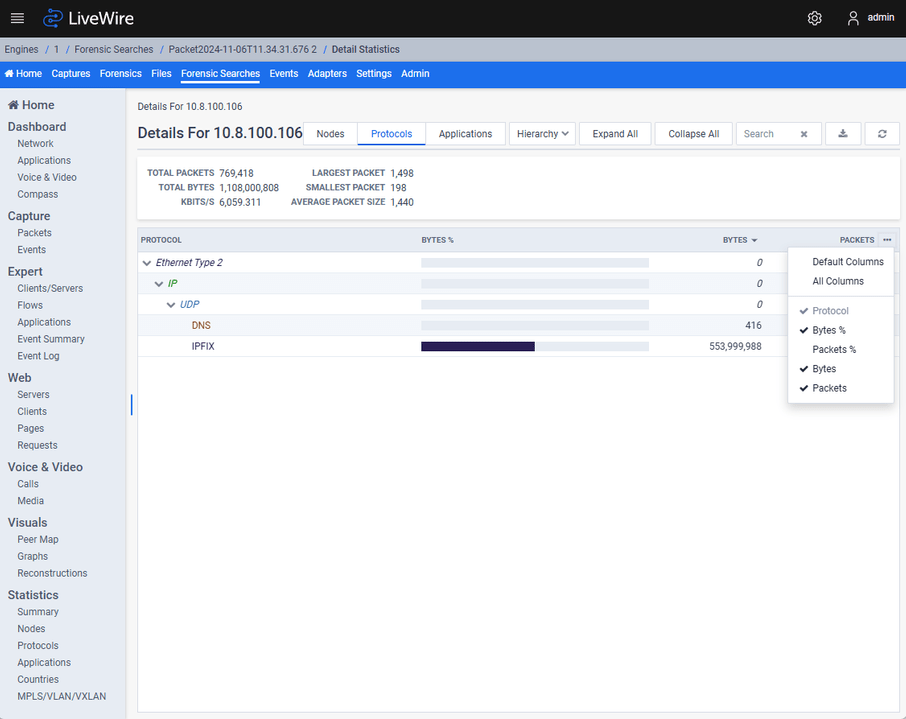
The protocols table can display the following values, which the user can toggle by clicking the “…” button on the far right of the table header:
◦ “Protocol” (default): If the “Show Port Names” is enabled in the configuration options (gear icon in the top left), the name of the protocol is shown if there is one. Otherwise, the protocol is displayed. If a color is associated with this node, the text will be displayed in that color.
◦ “Bytes %” (default):
◦ The percentage of bytes sent and received in comparison with all protocols in the Details Statistics View
◦ Hovering over the bar graph will display the numerical percentage value in a tooltip
◦ If a color is associated with this protocol, the text will be displayed in that color
◦ “Packets %”:
◦ The percentage of packets sent and received in comparison with all protocols in the Details Statistics View
◦ Hovering over the bar graph will display the numerical percentage value in a tooltip
◦ If a color is associated with this protocol, the text will be displayed in that color
◦ “Bytes” (default):
◦ The bytes sent and received in comparison with all protocols in the Details Statistics View is displayed on the top
◦ “Packets” (default):
◦ The packets sent and received in comparison with all protocols in the Details Statistics View is displayed on the top
The Hierarchy Mode:
◦ When showing protocols in hierarchy mode, if a tree item is expanded then the “Bytes %”, “Packets %”, “Bytes” and “Packets” values describe packets whose most specific protocol is that protocol. If it is collapsed, the “Bytes %”, “Packets %”, “Bytes” and “Packets” values include all packets that include that protocol in its protocol hierarchy.
Limit Message:
◦ If the protocol statistics limit has been reached, the user will see a red error banner above the protocols table detailing the limit that was reached.
 p
pContext Menu Operations:
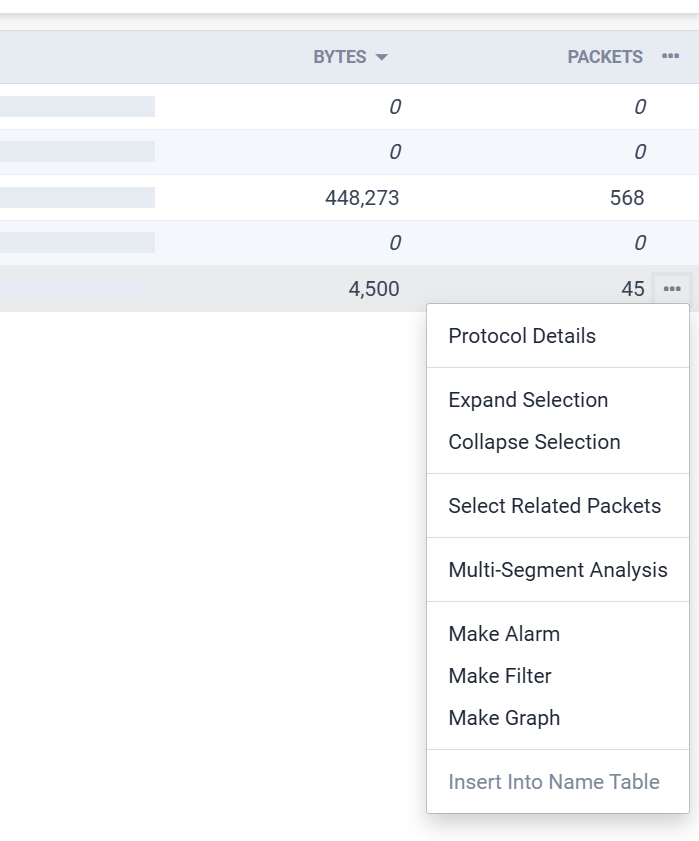
Clicking the “…” button at the end of each row in the table will display the context menu for each protocol with the following options:
◦ “Protocol Details”:
◦ Clicking this item will open a new Details Statistics View for the protocol in addition to the current nodes, protocols or applications for the current Details Statistics View
◦ This item will be disabled if the protocol is already a part of the current Details Statistics View
◦ “Expand Selection”: This item will expand all child items in the tree view for this protocol (only visible if viewing protocols in “Hierarchy” Mode)
◦ “Collapse Section”: This item will collapse all child items in the tree view for this protocol (only visible if viewing protocols in “Hierarchy” Mode)
◦ “Select Related Packets”: This item will redirect to the Packets View and select all packets in the Packets View that match the protocol. This item is disabled if the user cannot view packets or there are no packets in this Capture or Forensic Search.
◦ “Multi-Segment Analysis”: This item will redirect to the Multi-Segment Analysis View with the start and end time being the first and last time the protocol was captured, and the filter pre-populated with a filter for the protocol. This item is disabled if the user cannot upload files or create a forensic search.
◦ “Make Alarm”: This item will redirect to the Alarms View with the name of the new alarm being the protocol, and the units being “Total Bytes Per Second”
◦ “Make Filter”: This item will redirect to the Filters View with a protocol filter pre-populated with a filter for the protocol
◦ “Make Graph” (not in Omnipeek Windows): This item will redirect to the Graphs View with the name of the new graph being the protocol, and the units being “Bytes”, and the graph table pre-populated with the protocol and “Total Bytes”
◦ “Insert Into Name Table” (only enabled for protocols that aren’t already identified by protospecs): This item will pop up a dialog allowing the user to insert this protocol into the name table (the protocol type will be pre-populated to the best match, and the entry pre-populated to the protocol name)
Applications
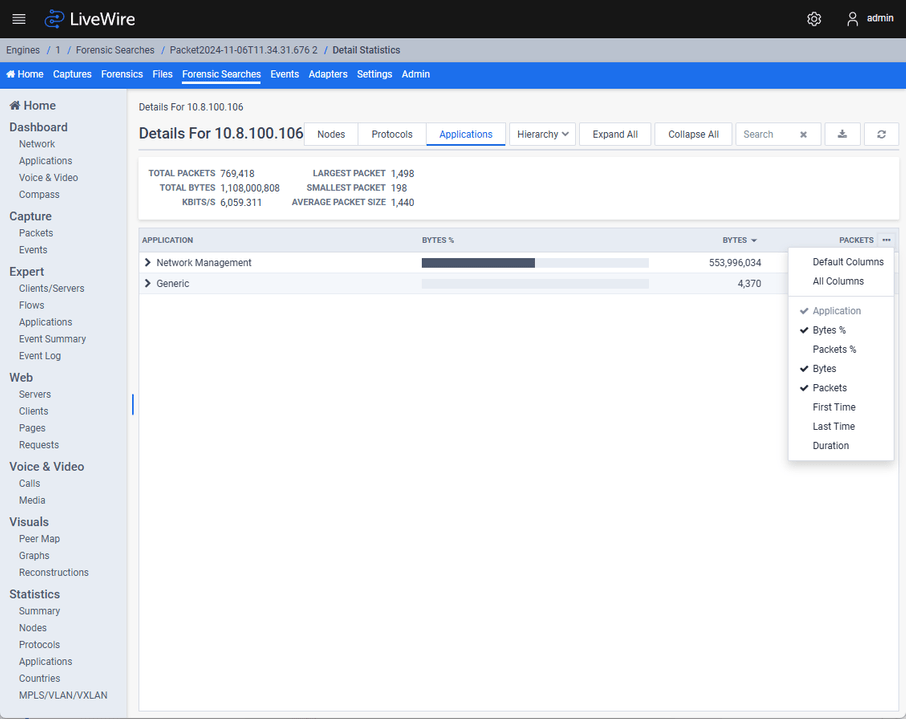
The applications table can display the following values, which the user can toggle by clicking the “…” button on the far right of the table header:
◦ “Application” (default): The name of the application. If a color is associated with this application, the text will be displayed in that color.
◦ “Category” (default, only in “Flat” Mode): The category of the application
◦ “Bytes %” (default):
◦ The percentage of bytes sent and received in comparison with all applications in the Details Statistics View
◦ Hovering over the bar graph will display the numerical percentage value in a tooltip
◦ If a color is associated with this application, the text will be displayed in that color
◦ “Packets %”:
◦ The percentage of packets sent and received in comparison with all applications in the Details Statistics View
◦ Hovering over the bar graph will display the numerical percentage value in a tooltip
◦ If a color is associated with this application, the text will be displayed in that color
◦ “Bytes” (default):
◦ The bytes sent and received in comparison with all applications in the Details Statistics View is displayed on the top
◦ “Packets” (default):
◦ The packets sent and received in comparison with all applications in the Details Statistics View is displayed on the top
◦ “First Time”: The timestamp of the first packet for this application
◦ “Last Time”: The timestamp of the last packet for this application
◦ “Duration”: The duration of time in which the packets for this application were captured
The Hierarchy Mode:
◦ When showing applications in hierarchy mode, the only parent item is the category for the children items.
Context Menu Operations:
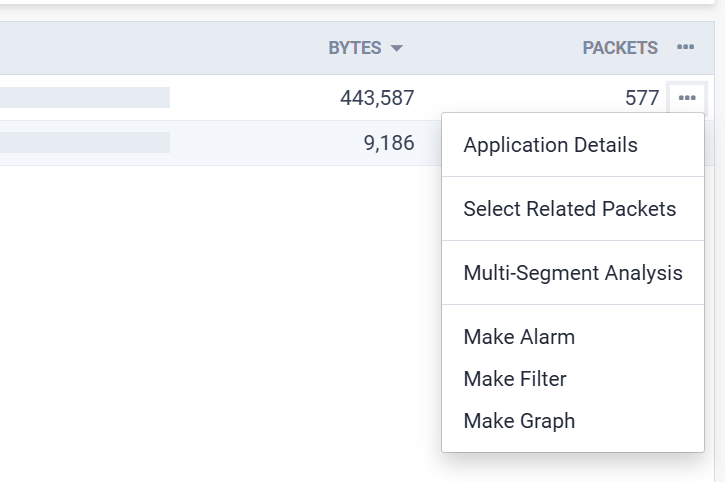
Clicking the “…” button at the end of each row in the table will display the context menu for each application with the following options:
◦ “Application Details”:
◦ Clicking this item will open a new Details Statistics View for the application in addition to the current nodes, protocols or applications for the current Details Statistics View
◦ This item will be disabled if the application is already a part of the current Details Statistics View
◦ “Select Related Packets”: This item will redirect to the Packets View and select all packets in the Packets View that match the application. This item is disabled if the user cannot view packets or there are no packets in this Capture or Forensic Search.
◦ “Multi-Segment Analysis”: This item will redirect to the Multi-Segment Analysis View with the start and end time being the first and last time the application was captured, and the filter pre-populated with a filter for the application. This item is disabled if the user cannot upload files or create a forensic search
◦ “Make Alarm”: This item will redirect to the Alarms View with the name of the new alarm being the application, and the units being “Total Bytes Per Second”
◦ “Make Filter”: This item will redirect to the Filters View with an application filter pre-populated with a filter for the application
◦ “Make Graph”: This item will redirect to the Graphs View with the name of the new graph being the application, and the units being “Bytes”, and the graph table pre-populated with the protocol and “Total Bytes”